
Ouster, Inc. OUST on Nasdaq
Lidar and perception sensors
The trusted lidar, at a full price.
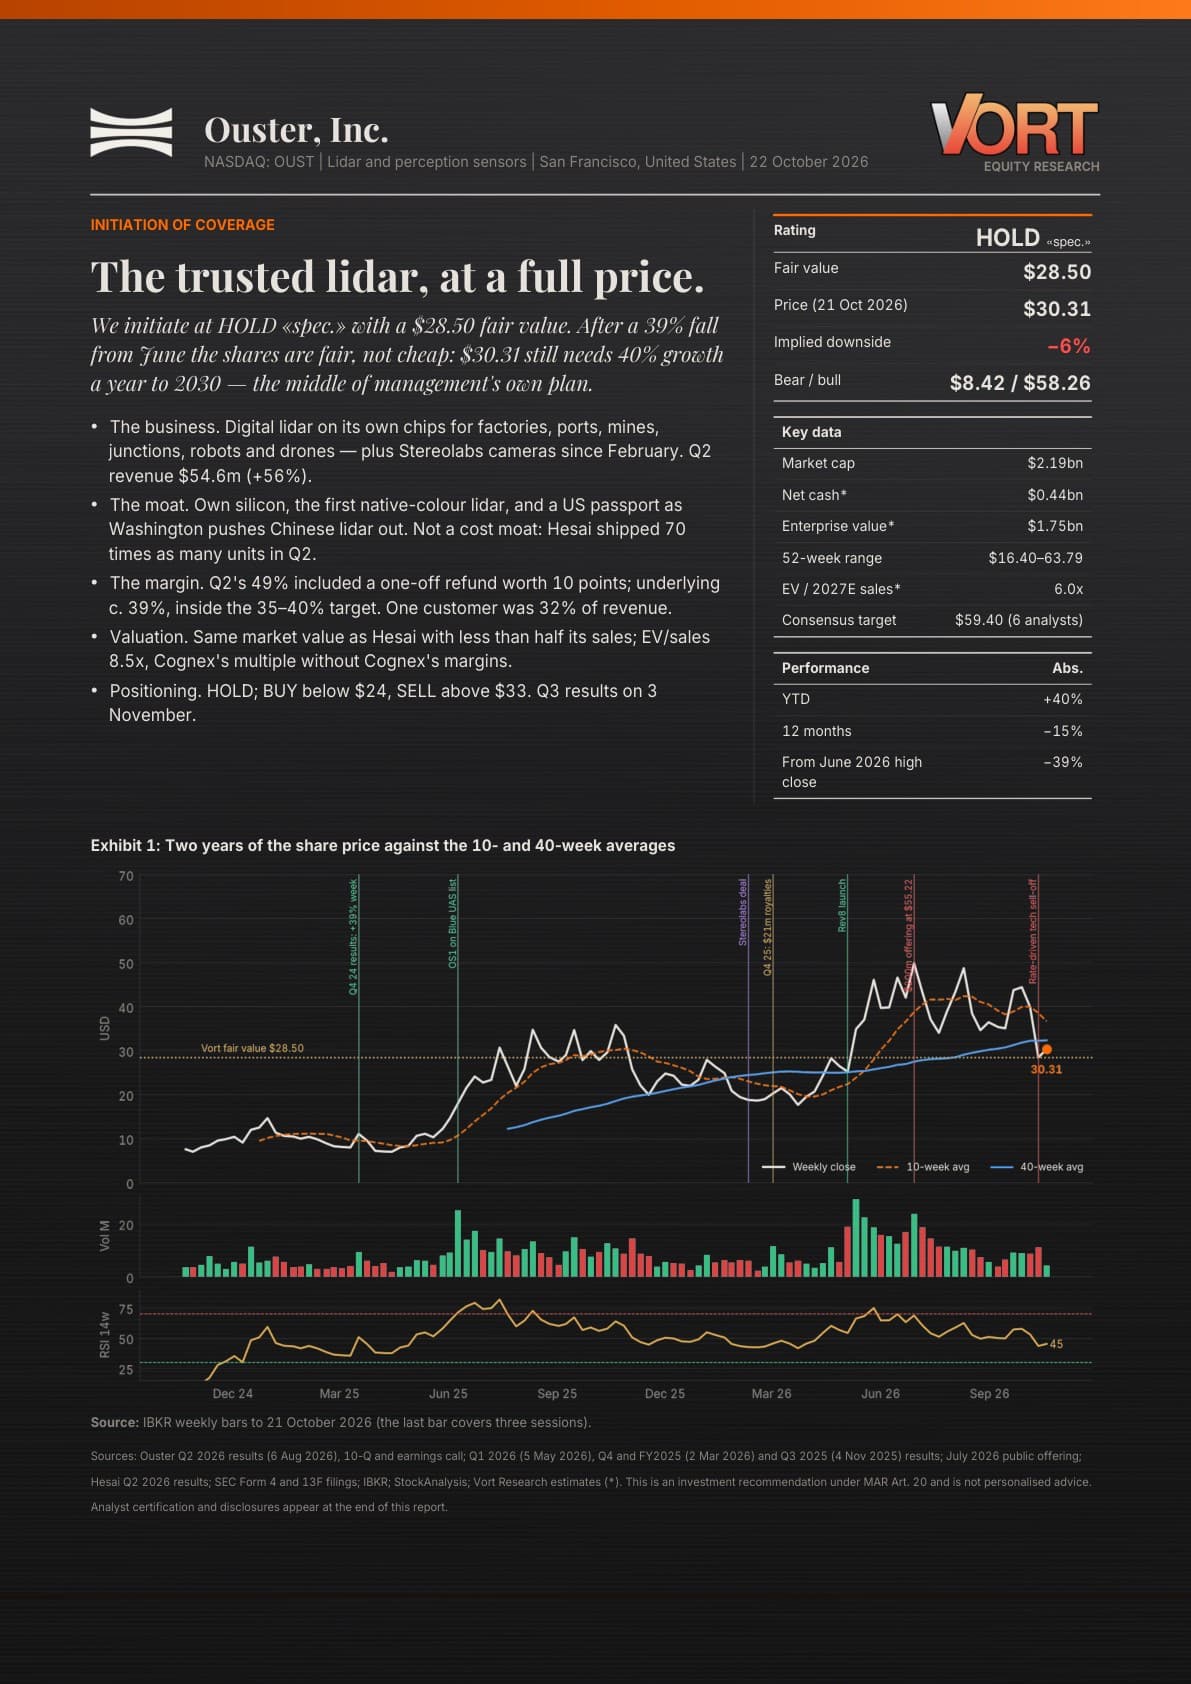
We initiate at HOLD «spec.» with a $28.50 fair value. After a 39% fall from June the shares are fair, not cheap: $30.31 still needs 40% growth a year to 2030 — the middle of management's own plan.
Published , 14 pages.
Rating
Hold
Fair value
$28.50
Last close
$30.31
Change on the previous close: +2.23% (+$0.66)
Upside to fair value
-6%
from the last close
12-month target
$28.50
$30.31 at the report$28.50 fair value
The US market is closed: the price is the close of October 21, 2026. During the session the quote is delayed up to 15 minutes. The fair value is the report’s, dated October 22, 2026; it does not move with the market. Vort Research provides informational and educational content. It is not personalised financial advice nor a solicitation to invest.
The full report is for Vort+ members.
The rating, the fair value and the reasoning on this page are public. The PDF downloads with Vort+; if you already have it, sign in.
Summary
Second-quarter 2026 revenue was $54.6m, up 56%, on lidar units up 70%, and Rev8, the first lidar that sees in colour, starts volume production this half.
The 49% gross margin included a one-off refund worth about 10 points, c. 39% underlying; one customer was 32% of revenue, and Hesai ships 70 times as many units.
The price needs 40% growth a year to 2030, the middle of management's own plan, against 30% in our base case. Our fair value is $28.50, 6% below the $30.31 price, and the rating is HOLD «spec.».
Scenarios
- Bull$58.26
- Base$23.66
- Bear$8.42
Fair value sensitivity
Fair value per share for every 2030 revenue and EV/EBITDA multiple, the two inputs of the report’s valuation, with the price at the report as the plane through it.
Fair value of OUST by 2030 revenue and EV/EBITDA multipleFair value per share, in US dollars
Source: Vort Research, report of October 22, 2026.
−50%+50%against the price
Hover over the chart to read a case. The surface turns slightly. The arrow keys move the selection.
Sensitivity table, in dollars per share
| × \ Rev. | 400M$400M | 550M$550M | 630M$630M | 700M$700M | 850M$850M | 1B$1B |
|---|---|---|---|---|---|---|
| 35× | 21.60 | 27.77 | 31.06 | 33.93 | 40.10 | 46.27 |
| 30× | 19.25 | 24.54 | 27.36 | 29.82 | 35.11 | 40.39 |
| 25× | 16.90 | 21.31 | 23.66 (base case) | 25.71 | 30.12 | 34.52 |
| 20× | 14.55 | 18.08 | 19.96 | 21.60 | 25.13 | 28.65 |
| 15× | 12.21 | 14.85 | 16.26 | 17.49 | 20.13 | 22.78 |
Hover over a cell and the case lights up on the surface.
- 2030 revenue
- $630M
- EV/EBITDA
- 25×
- Fair value
- $23.66
- Against the price at the report
- -21.9%
What the price assumes
- 2030 revenue implied by the price (EV/EBITDA multiple 25×)
- $856.57M
- EV/EBITDA implied by the price (2030 revenue $630M)
- 33.99×
- Cases above the price
- 27% (146 of 549)
- Fair value range
- $12.21 – $46.27
- 2030 revenue up $10M from the chosen case
- +$0.29
- EV/EBITDA up 2.5× from the chosen case
- +$1.85
What the marks on the chart mean
- Fair value per share across 549 cases. It is green above the price, red below and grey at par.
- The price at the date of the report, $30.31
- Where fair value equals the price, which is what the market already assumes
- Contour lines join cases with the same fair value, one every $5.00
- The two slices through the chosen case, at constant EV/EBITDA multiple and at constant 2030 revenue
- Base case: 2030 revenue $630M, EV/EBITDA multiple 25×
The figures are the report’s own. It is not investment advice.