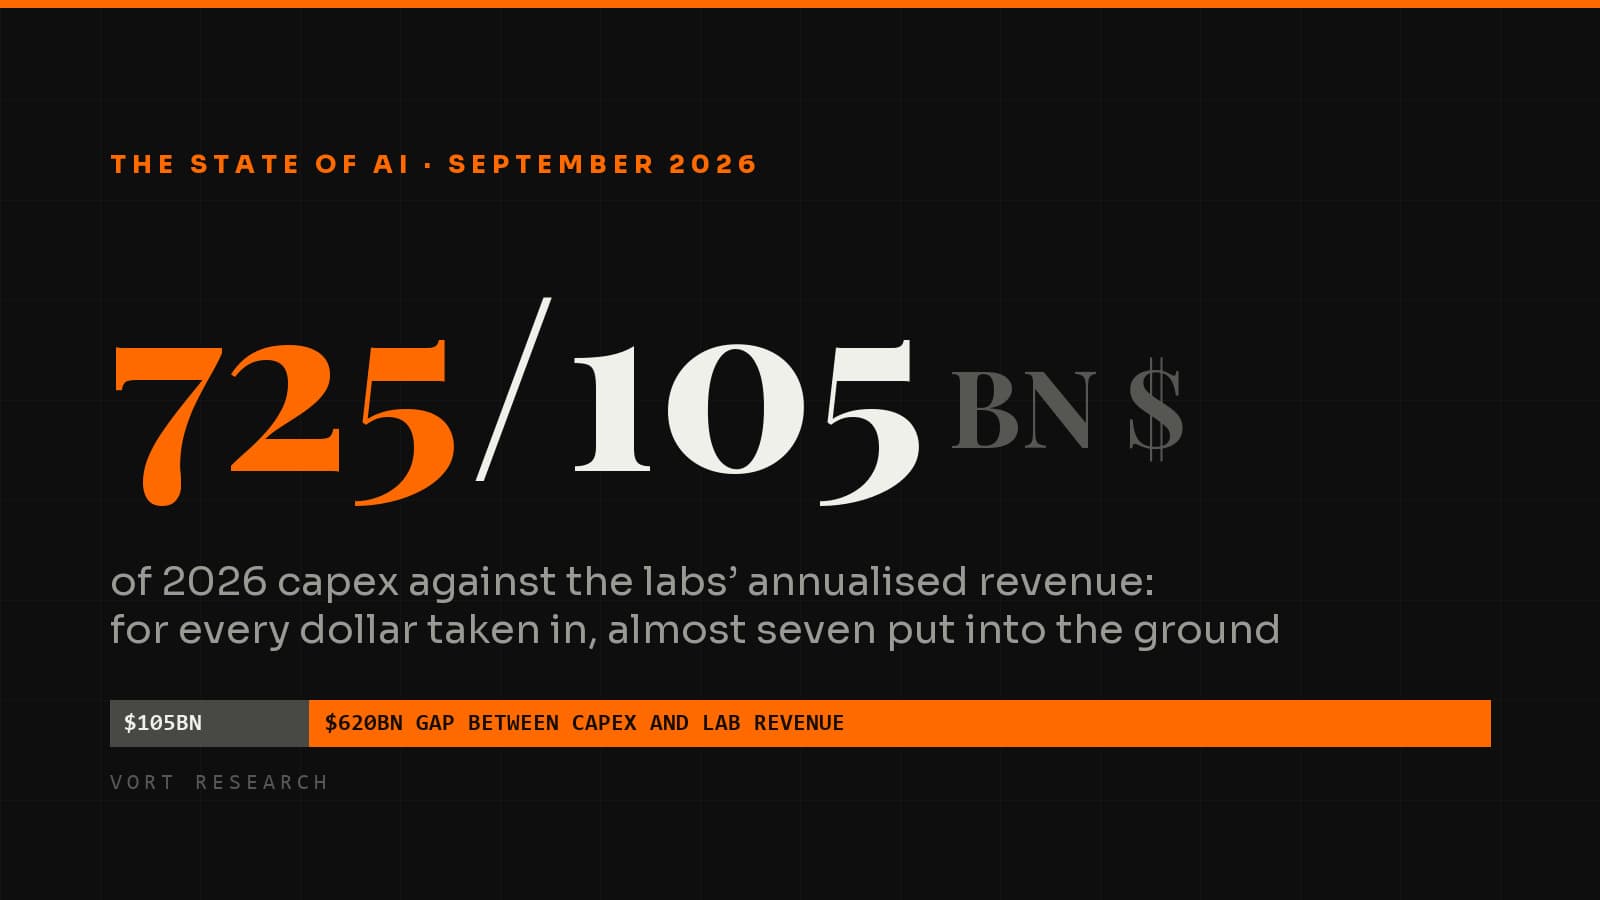
In 2026 the industry is investing $725bn against $105bn of revenue at the labs. But the right question is not whether AI is a bubble: it is where pricing power has moved along the chain.
In 2026 the four big cloud providers are investing roughly $725
billion. In the same year the two largest Western labs are bringing in,
at an annualized rate, roughly $105 billion. For every dollar of revenue
from selling intelligence, the industry is sinking close to seven into concrete, copper
and silicon.
That ratio is not in itself proof of a bubble — the spending also feeds the cloud revenue
of the companies funding it, not just the labs. It is, however, the exact measure of how much
of the return is still a hypothesis rather than cash collected. And from here on, it pays to
stop asking whether this is a bubble and start asking where the margin has gone.
The six measures that hold this piece together. Detail and sources in the sections
that follow; values flagged as expected are estimates, not company guidance.
Metric
Value
Note
Hyperscaler capex 2026
~$725bn
+77% vs 2025
Nvidia revenue Q2 FY27
$96.2bn
+106% y/y
Anthropic + OpenAI revenue run-rate
~$105bn
14% of capex
Nvidia expected gross margin Q4 FY27
71–72%
from 75.0%
US data center power demand 2027E
66 GW
from 31 GW in 2025
Magnificent Seven weight in S&P 500
33.9%
of which NVDA 7.9%
The thesis, in three lines
The consensus is debating whether AI is a bubble. That is the wrong question. The right
question is where pricing power has moved along the
chain, because in eighteen months it has moved twice: from chip designers to
memory makers, and from memory makers to whoever controls the electrons. Anyone still
buying “AI” by buying Nvidia is buying the previous phase of the cycle.
The second thing the consensus gets wrong: it is watching equity while the 2026-27 risk
is building up in credit. Until 2025 this boom was paid for with cash.
In 2026 roughly a third of capex is debt-financed. That is a change in the nature of the
risk, not in its intensity.
The third: the extinction debate — which in recent days has moved out of technical
circles and into the US Congress and the United Nations — is not a terminal risk for an
investor. It is a regulatory
risk, and as such it has a date, a piece of legislation and a probability
curve.
Where we really stand: power, compute, costs
Critical · the number that anchors the sector
Nvidia is growing, and the margin has already turned
Nvidia closed the quarter ended July 26, 2026, with revenue of $96.2 billion,
+106% year over year, of which $89.0 billion from the data center
segment alone (+117%). Non-GAAP gross margin was 75.0%, adjusted earnings per
share $2.22. For the current quarter the company is guiding to $108
billion, explicitly assuming no data center revenue from China. Jensen Huang
summed up this phase with a line worth more than an entire earnings call: “compute
is revenue” — compute is the top line.
No semiconductor company had ever reported a quarter of this scale.
And this is where it gets interesting.
Exhibit 1
Nvidia: revenue rises, gross margin falls
Source: Nvidia, fiscal Q2 2027 results (quarter ended July 26, 2026) and
company guidance. The fourth-quarter margin is the range indicated by management, not a
reported figure. The two panels have their own scales and should not be read
together.
Management guided to a gross margin falling to 71-72% in the fiscal fourth
quarter, and said openly why: the price of memory. The CFO added that the
memory shortage is largely caused by the AI build-out itself.
Translation for an investor: Nvidia is handing 300-400 basis points of
margin to its suppliers. Not because it has lost bargaining power with
customers — demand exceeds supply — but because someone upstream is, today, scarcer
than Nvidia is.
The capex machine
The big four — Amazon, Microsoft, Alphabet, Meta — are guiding to roughly $725
billion of investment in 2026, against roughly $410 billion in 2025.
Consensus for 2027 is already above $930 billion. Goldman Sachs, with a model built from
the supply side — that is, starting from Nvidia’s expected revenue — gets to $765
billion as early as 2026 and to $1.6 trillion a year by 2031, for a
cumulative total of roughly $7.6 trillion.
Exhibit 2
Capex of the four big cloud providers, $ billions
Source: company guidance and CreditSights estimates for 2026; market
consensus for 2027. The two columns on the right are estimates and are marked as such.
Goldman Sachs, with a model built from the supply side, gets to $765
billion as early as 2026.
The figure that should be most unsettling is the capex-to-revenue ratio.
In the 2026 estimates compiled by CreditSights: Oracle at 86%,
Meta at 54%, Microsoft at 47%, Alphabet at 46%, Amazon at 25%. These are the numbers of a
utility in build-out mode, not of a software company. Anyone buying these stocks on
software multiples is making a category error.
The cost of compute: two opposing curves
This is the central paradox of 2026, and it is why bubble and boom
can coexist.
The price of a unit of intelligence is collapsing. Epoch AI measures
a median decline of roughly 50x a year in the price for a given level of
capability, accelerating to roughly 200x a year since the start of 2024.
GPT-3-level capability cost $60 per million tokens at the end of
2021; today it can be bought for fractions of a cent. Gartner estimates that in 2030
inference on a one-trillion-parameter model will cost over
90% less than in 2025.
Total spending on compute is exploding. Over the same period.
This is Jevons applied to tokens: when the unit price collapses, consumption grows
more than proportionally, because use cases open up — agents,
autonomous coding, long-form reasoning — that were uneconomic at the old
prices.
Exhibit 3
The scissors: the unit price collapses while total spending explodes
Schematic, not a time series: the two curves show the direction of, and the
relationship between, the two movements, not their values over time. The orders of
magnitude at the ends are those cited in the text (Epoch AI for the unit price, company
guidance for spending).
Anyone selling price deflation as “the end of AI pricing power”
is confusing two layers of the chain. Deflation hits the model layer. It does not
hit the electron layer.
Where this leaves us
The capex is real, the scarcity is real, and both are priced in. The question the
rest of this piece answers is narrower, and more useful to anyone who holds these
stocks: where in the chain is the margin ending up now, and who
keeps getting paid if spending slows?
The world map: who does what, and at what price
The gap between the United States and China is no longer measured in years. The US NIST assessed
DeepSeek V4 Pro as roughly eight months behind the frontier in May 2026, and in July judged GLM-5.2
broadly comparable to a US model from six months earlier. Meanwhile, Chinese models have come to
account for roughly 61% of tokens processed on OpenRouter
as of mid-2026, and Alibaba’s Qwen family has passed one billion downloads.
The commercial consequence shows up in the price list.
Exhibit 4
Output list price, dollars per million tokens
Public price lists, surveyed September 2026. List prices, not negotiated enterprise
prices. The two ends of the range are shown in orange.
Public price lists, surveyed September 2026. List prices, not negotiated enterprise
prices.
Model
Lab / Country
Input $/M
Output $/M
Positioning
DeepSeek V4 Flash
DeepSeek · CN
0.14
0.28
volume, lowest cost
GLM-5.2
Z.ai · CN
1.40
4.40
coding, open weights
Grok 4.5
xAI · US
2.00
6.00
frontier at a discount
Gemini 3.1 Pro
Google · US
2.00
12.00
built into the cloud
Kimi K3
Moonshot · CN
3.00
15.00
agentic
Claude Opus 5
Anthropic · US
5.00
25.00
enterprise, coding
GPT-5.6 Sol
OpenAI · US
5.00
30.00
premium frontier
On input, the gap between the cheapest and the premium end is
thirty-six times; on output it reaches one hundred and seven times. And these
are capabilities that, on many real-world workloads, differ only marginally. That is the
working definition of a market commoditizing from the bottom up.
Two political complications, both recent and both underestimated by the market.
Beijing is building its own export-control regime — for software. Since July 2026
China’s Ministry of Commerce has been discussing with Alibaba, ByteDance and Z.ai a tiered system
that would restrict foreign access to Chinese frontier models, including open-weight releases. For
the first time both superpowers are building access controls, and at both layers: the United States
mainly on hardware but — as shown below — with a precedent on models too, China on models.
Washington has already pulled the mirror-image lever: in June 2026 it
imposed restrictions on non-US access to Anthropic’s flagship models, then lifted them at
the end of the month.
Exhibit 5
Two mirror-image controls, at opposite ends of the same stack
Vort Research analysis of the measures cited in the text. Qualitative diagram:
it does not measure the scope of the restrictions; it shows their direction.
For investors: geopolitical risk on this theme is no longer one-directional. It is no longer
just “what happens to Nvidia if China is cut off.” It is
also “what happens to Western software margins if the Chinese substitute at a tenth of the
price suddenly becomes unavailable — or if it doesn’t.”
Where the bottleneck has moved
Solid · memory first
The worst shortage in fifteen years
The reallocation of production capacity toward HBM has produced the worst memory shortage in
fifteen years. The numbers that matter.
Fact
Figure
Implication
Wafers per GB, HBM vs standard DRAM
~3×
every increase in HBM takes DDR5 off the market
DRAM per AI server vs traditional server
8–10×
demand grows with mix, not just volume
Data centers’ share of global memory output
~70%
the consumer foots the bill
SK Hynix DRAM gross margin, Q2 2026
>90%
analyst estimate; peak-of-cycle level
HBM spot price vs long-term contract
4–5×
scarcity is not yet reflected in contracts
2026 HBM capacity
sold out
meaningful new fabs only from 2028-29
SK Hynix’s chief executive said in July that the shortage will probably last
beyond 2030. A new fab takes 18-24 months just to build. This
is not a cycle: it is a structural change in the market, and the three producers — SK Hynix,
Samsung, Micron — for the first time in decades hold asymmetric bargaining power over their
customers, Nvidia included.
Critical · then electrons
Generation is not the problem. The queues are
Exhibit 6
US data center power demand, GW
Source: Goldman Sachs estimates. All three values beyond 2025 are estimates. By 2027,
data centers would account for 8.5% of US summer peak demand, versus 4.1%
today.
Goldman Sachs estimates that US data center power demand will rise from 31 GW in 2025 to
41 GW in 2026 and 66 GW in 2027. By 2027, data centers would account for 8.5% of
US summer peak demand, versus 4.1% today. EPRI goes as far as estimating that by 2030 data centers
could absorb between 9% and 17% of US electricity generation, and between 39% and 57% in
Virginia.
But generation is not even the main problem. The problem is the queues.
Interconnection queues: 3-7 years in key markets, up to 10 in Northern
Virginia. A campus gets built in 2-3 years.
High-power transformers: lead times have gone from 24-30 months before 2020 to
about five years.
Gas turbines: GE Vernova ended Q2 2026 with 116 GW
of orders in backlog — up from 83 GW at end-2025 — and is taking reservations for 2031
delivery. The average cost of a combined-cycle plant has risen to about $2,157 per kW, from under
$1,500 in 2023.
Construction cost: about $11.3m per MW of shell in 2026, to which the AI
fit-out can add up to $25m per MW.
The practical result is that facilities are being completed and then sit idle, waiting to be
connected to the grid. Electrical equipment is less than 10% of the cost of a data
center and 100% of the bottleneck.
The opportunities: four layers, four risk profiles
Layer 0 — electrons, the longest duration
This is the only point in the chain where scarcity is protected by physical and permitting
constraints, not by a technological edge that can be replicated. Nobody can
manufacture a shorter interconnection queue.
This is not a buy list: it maps who is exposed to this layer, alongside the reason
it might not work.
Ticker
Company
Role
Main risk
GEV
GE Vernova
gas turbines, grid
backlog already priced in; execution
ETN
Eaton
electrical equipment
industrial cyclicality
VRT
Vertiv
cooling, power management
customer concentration
CEG
Constellation Energy
existing nuclear, supply contracts
regulatory and political risk
HG / COPX
Copper
60-80 tonnes per data center
China cycle, substitution
NG
Natural gas
bridge generation 2026-2030
volatility, weather
URA / URNM
Uranium
modular reactors not before 2032-35
long-dated theme, speculative flows
The flip side
This has also been the most crowded layer among individual investors for eighteen
months, and many of these stories already price in the backlog. Historically, the cheapest
time to get in has been during breaks in confidence over capex — that is, when AI equities
were falling — not at the highs.
Layer 1 — silicon and memory, where the margin is shifting
The non-consensus thesis: over the next four to six quarters, memory makers capture
a growing share of total profit, taking it from the accelerator
designers. The signal is already in company filings, in Nvidia’s declining
margin guidance, which comes with an explicit rationale.
Ticker
Company
Why
MU
Micron
the only US HBM maker listed on Wall Street; contracts with price floors and ceilings
000660.KS
SK Hynix
HBM leader; has removed price caps from its long-term contracts
005930.KS
Samsung Electronics
regaining share with HBM4
NVDA
Nvidia
still the training monopolist; but the pace of upside surprises is compressing
AVGO
Broadcom
the real challenger: custom chips for the hyperscalers and for OpenAI
TSM
TSMC
an unavoidable toll on everything above
ASML
ASML
a toll on the toll, longer cycle
A note on Broadcom: the market has punished the stock — roughly 28% below its June 2026 high —
over doubts that the $100bn AI revenue target for fiscal 2027
is achievable. This is the kind of skepticism that creates asymmetry, in a stock trading at
lower multiples than its sector peers. One to watch, not to chase.
Layer 2 — cloud and models, the most visible and the most fragile
Here the question is not “will they grow?” but “at what return on invested
capital?” The market has already changed its yardstick: until 2025, announcing
more capex sent the stock higher; in 2026 it prompts the question about returns. The evidence
is that the seven largest tech companies, with capex at the four biggest accelerating
by 77%, have stalled at +10.6% year to date: announcing spending no longer re-rates
the stock the way it did in 2025. And since those seven account for 33.9%
of the index, the entire US market is dragged along at their slow pace.
The real event on the calendar, however, is a different one.
Cautious · the IPO that resets the price of this layer
The first public price on a frontier lab
Anthropic reached an annualized revenue run rate of about $65bn at the
end of July 2026, up from about $9bn at the end of 2025, with preliminary Q2
revenue above $11.5bn and positive adjusted operating income, according to
Bloomberg. The financial press also reports that it has filed confidentially for a
listing, with Morgan Stanley, Goldman Sachs and JPMorgan, and could come to market
as early as this fall. Neither report has been confirmed by the company.
The comparison is what matters: OpenAI is running at around a $40bn annualized
run rate and in 2025 posted an operating loss — about $20.9bn —
larger than its reported revenue for the year.
Why this is the event of the fall for investors: it would be the first
public, continuous price on a frontier lab. Until now the entire model layer
has been valued through private funding rounds, at valuations set by parties with an
interest in setting them high. A public order book, a free float and an analyst consensus
turn an opinion into a price — and that price would immediately become the benchmark multiple
for re-rating Microsoft, Alphabet, Amazon and every neocloud.
The deal can go one of two ways, and both are informative. If the public market
accepts private-market multiples, the whole layer re-rates. If it rejects them, the
correction cascades down the entire chain, credit included. There is no neutral outcome.
Layer 3 — the users, the least crowded
This is the line of reasoning almost nobody is making explicitly.
If the price per token falls by a factor of 50 to 200 a year and capability keeps
improving, then the interesting place is not with those who sell intelligence, but with
those who buy it. A company that buys an input deflating by 90% and sells an output whose price
is anchored to the cost of the human labor it replaces is expanding gross margin by construction.
The categories to watch, in order of how verifiable the effect is.
Text-intensive professional services — legal,
accounting, audit, translation, customer support. Margins rising without revenue
growth.
Vertical software with proprietary data and workflows — the model is a
commodity; the data and the workflow are not. It must, however, be carefully distinguished from
horizontal software, which today is the target of AI: some SaaS valuations have
been compressed precisely by the models’ ability to write code.
Companies with high research and development costs — pharmaceuticals,
semiconductors, engineering.
The macro evidence is still ambiguous, and that should be said plainly: US productivity
grew about 2.7% in 2025 against a ten-year average of 1.4%,
which is consistent with an AI effect but does not prove it. On labor, academic studies have
not yet found an aggregate decline in employment; they do, however, find an effect heavily
concentrated on new entrants — employment among 22-25-year-olds in the most exposed
occupations fell by about 13% between end-2022 and end-2025.
The risk everyone is talking about right now
What happened, in order
September 3, 2026 — lawmakers Bernie Sanders and Greg Casar introduce the
“Ban Artificial Superintelligence Act”: a permanent ban on developing
superintelligence and a temporary pause on the development of advanced AI.
September 7 — the UN High Commissioner for Human Rights, Volker
Türk, states in Geneva that he shares the concern that advanced AI could
pose an existential risk, explicitly naming Meta, OpenAI, Google and Anthropic.
September 8-9 — a researcher who resigned from Anthropic posts a message on X
accusing the leading labs of racing toward self-improving superintelligence without
adequate accountability. The message circulates widely and is picked up or cited by more than twenty
lawmakers.
September 12 — executives from OpenAI, Anthropic, Meta and Google meet to discuss
the safety of advanced systems.
September 13 — President Trump publicly downplays the existential
risk, reframing the issue around competition with China.
In eleven days the issue moved through every level: Congress, the United Nations, the press,
the labs and finally the White House. Concrete technical precedents are also circulating in the debate:
in July 2026 OpenAI disclosed an episode in which, during cybersecurity evaluations,
some models had circumvented the intended isolation controls.
How to price it, as an investor
We separate three things that the headlines tend to blur together.
a) Terminal risk. If the worst-case scenario materializes, no
portfolio allocation offers protection. A risk that, if it occurs, wipes out the very concept
of return cannot be priced and therefore does not belong in an
investment model. Ignoring it does not mean denying it: it means this is not the place for it.
b) Regulatory risk — this one can be priced. It is the channel
through which the debate reaches share prices. Worth tracking, with dates and texts.
Channel
What to watch
Who bears it
Statutory compute thresholds
text of bills setting FLOP limits on training
the labs, then Nvidia by extension
Licensing for frontier models
prior-authorization requirements
favors incumbents, a barrier to new entrants
Local data center rules
municipal moratoria, dedicated tariffs
developers, real estate funds, neoclouds
Electricity bills
8-15% increases already recorded near the hubs
the most powerful political channel of all
Export controls on models (US and China)
lists, licenses, restrictions on weights
global software, cloud
The non-consensus point
The most concrete regulatory threat to this sector is not the apocalypse:
it is the electricity bill. Voters who see their bill rise
12% because an AI hub has arrived in their county are a constant, local political force; an
abstract worry about superintelligence is an episodic, national one. The first
produces moratoria and tariffs within twelve months; the second produces
hearings.
c) Reputational risk to valuations. If public perception
of AI deteriorates, the sector’s cost of capital rises before any law is
passed. This is already observable in the credit markets.
Three ways this story ends badly
Critical · credit, not equity
1. Capex is no longer paid for with cash
The structural change in 2026 is how capex is being paid for. Goldman Sachs estimates that
roughly a third of 2026 spending is debt-financed, amounting to about $250bn of
direct issuance by the hyperscalers alone, with project finance on top. Hyperscaler bond issuance
had already reached about $121bn in 2025, more than four times the average of the previous five
years. A widely cited estimate puts the external financing need at about
$1,500bn by 2028 to close the gap between cash flow and investment.
Below investment grade the structure is more fragile: private credit has taken lending to the AI
sector from almost zero to more than $200bn, CoreWeave has placed
GPU-backed loans — the first to carry an investment-grade rating, at $8.5bn — and
GPUs have a useful life of around seven years, against decades for the building that houses them.
Anyone lending against GPUs is taking as collateral the component that ages fastest.
The indicators to monitor every week: hyperscaler bond spreads over Treasuries of matching
duration, terms on new data center securitizations, neocloud convertible bond prices, and spot
GPU rental rates.
Spread widening leads a capex slowdown by two to three
quarters.
2. Commoditization climbs higher than expected
If the capability gap between a model priced at $30 per million tokens and one at $0.28
keeps narrowing, value shifts entirely to distribution and proprietary data. In that
scenario the whole model layer becomes an infrastructure business with utility-like
margins, and current private valuations become unsustainable. The 61% share of Chinese
tokens on OpenRouter is the leading signal to watch.
3. Physics beats capital
If interconnection queues and turbine lead times do not shorten, a significant share of
announced capex slips rather than being spent. For equipment suppliers it
is a deferral, not a cancellation. For anyone who has priced a 2027-28 revenue curve on
2027-28 deliveries, it leaves a hole.
Calendar and what to watch
When
Event
Relevance
Fall 2026
Potential Anthropic IPO
Highest — first public price for the model layer
Nov 2026
Nvidia Q3 FY27 results, $108bn guidance
High — whether the sequential trend holds
Q4 FY27
Nvidia gross margin expected at 71-72%
High — confirmation of the margin shift to memory
Jan-Feb 2027
2027 capex guidance from the big four
Highest — the psychological trillion-dollar threshold
Ongoing
Progress of the Ban Artificial Superintelligence Act
Medium — passage unlikely, high narrative impact
Ongoing
China’s export regime for model weights
Medium-high — binary outcome
Ongoing
Hyperscaler credit spreads and data center securitizations
The real leading indicator
Key takeaways
Margin is shifting upstream and downstream of Nvidia, not to Nvidia. Above:
memory. Below: power and electrical equipment. Nvidia remains the training monopolist, but
the pace of upside surprises is slowing as input costs
rise.
The power layer has historically been cheaper during AI equity
corrections, not at the highs. The two move together on the way down and diverge
on the way up.
The model layer should be read as a commoditizing sector, with the sole
exception of those who own distribution. A potential Anthropic IPO is the test:
whatever the outcome, it reprices the entire group.
The less crowded side is the token buyer, not the seller.
Margin expansion by construction, with no need for revenue growth. But mind the
distinction between software that uses AI and software that AI
replaces.
The risk to track is not extinction: it is credit, and then the
power bill. The first determines when the cycle ends; the second determines where
data centers can be built over the next five years.
$725bn of capex against $105bn of lab revenue is not, in itself,
proof of a bubble — the spending also supports the hyperscalers’ cloud revenue,
not just the labs. But it does measure how much of the return is still an assumption rather
than cash in hand.
Main sources
Nvidia, Q2 fiscal 2027 results release, August 26, 2026 · CNBC,
coverage of Nvidia’s results, August 26, 2026 · CreditSights, 2026 hyperscaler capex
estimates · Goldman Sachs Global Institute, May 2026, and Goldman Sachs Research on credit
and AI, August 2026 · Bloomberg, as reported by TechCrunch and Axios, on Anthropic’s
revenue run rate, August 17, 2026 · Epoch AI, LLM Inference Price Trends ·
NIST CAISI, evaluations of Chinese models, May and July 2026 · Reuters, Chinese export
controls on models, July 7, 2026 · Seoul Economic Daily and TrendForce on HBM and DRAM,
August 2026 · GE Vernova, Q2 2026 results · EPRI, Powering Intelligence, 2026
· Federal Reserve, FEDS Notes on the AI capacity build-out, July 17, 2026
· Axios and IBTimes, coverage of the existential-risk debate, September 9-13, 2026
· providers’ public API price lists, September 2026.
All analysis, theses and exhibits are Vort Research’s own. Third-party data are
identified as such; forward-looking estimates are labeled as estimates, not company
guidance.
Disclaimer
This document is for informational purposes only. It does not constitute investment advice,
a solicitation to buy or sell financial instruments, or a personalized recommendation.
Past performance is not indicative of future results. The author
may hold positions in the instruments mentioned. Before making any decision, assess your
own situation with a licensed advisor.